Propka
Today I’d like to introduce the PROPKA method which I simply love when it comes to pKa prediction. I find it more accurate than any other servers, because it predicts the pKa values of ionizable groups in proteins based on the 3D structure.
There are mainly two steps to use Propka at its full potential.
Step 1
Unfortunately the Propka website has been “under maintainance” for quite a while. Fortunately we can still use it in the PDB2PQR tool: http://nbcr-222.ucsd.edu/pdb2pqr_2.0.0/
Here is the procedure:
- Upload your pdb file (You don’t have to prepare the .pdb file by adding/removing hydrogens. The propka server uses its own internal hydrogen placement algorithm.)
- Under pKa Options, change the pH under “Use pH …”, if necessary
- Submit

- Save the .propka file
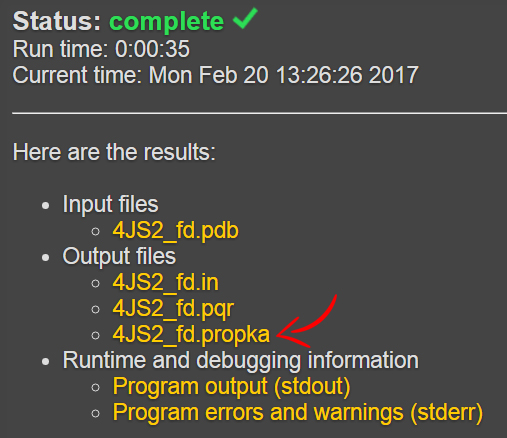
- Change the extension from .propka to .pka

Step 2
The .pka file contains a table of all amino acid that have pKa values. For each residue that has been evaluated, you will be able to read the pKa, the burying percentage (how accessible the residue is form the surface), the Coulombic ineractions, hydrogen bonds, etc. It’s pretty neat, and super useful already!
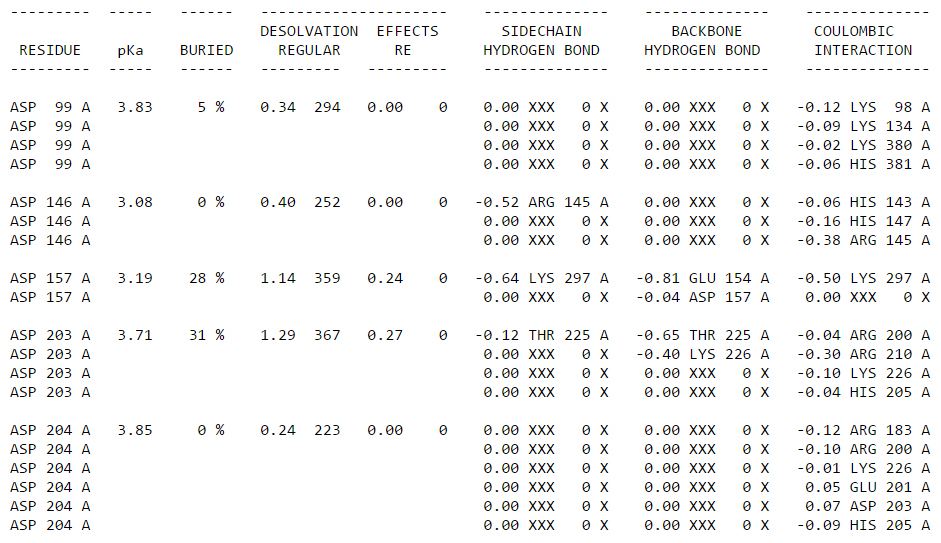
You can of course just read the table, but I think it’s much better to look at the values directly on the structure! In order to do that, you will need the propka.py script that you can download from here: https://pymolwiki.org/index.php/Propka
Save the propka.py in the same folder where your .pdb file and .pka file are.

Then:
- Run PyMOL under linux environment (under Windows, you can run it through the terminal and it works if you have python installed)
- Open the PDB file used for the calculation
- Type:
import propka
propka pkafile=./nameofyourpkafile.pka
This will create a pymol command file (.pml) in the same directory.
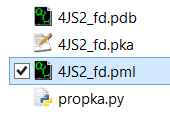
You don’t need to do this procedure more than once. The next time you want to look at your pka values and pdb file at the same time, load the pdb file and then type run the .pml file inside PyMOL.
Visualizing the output
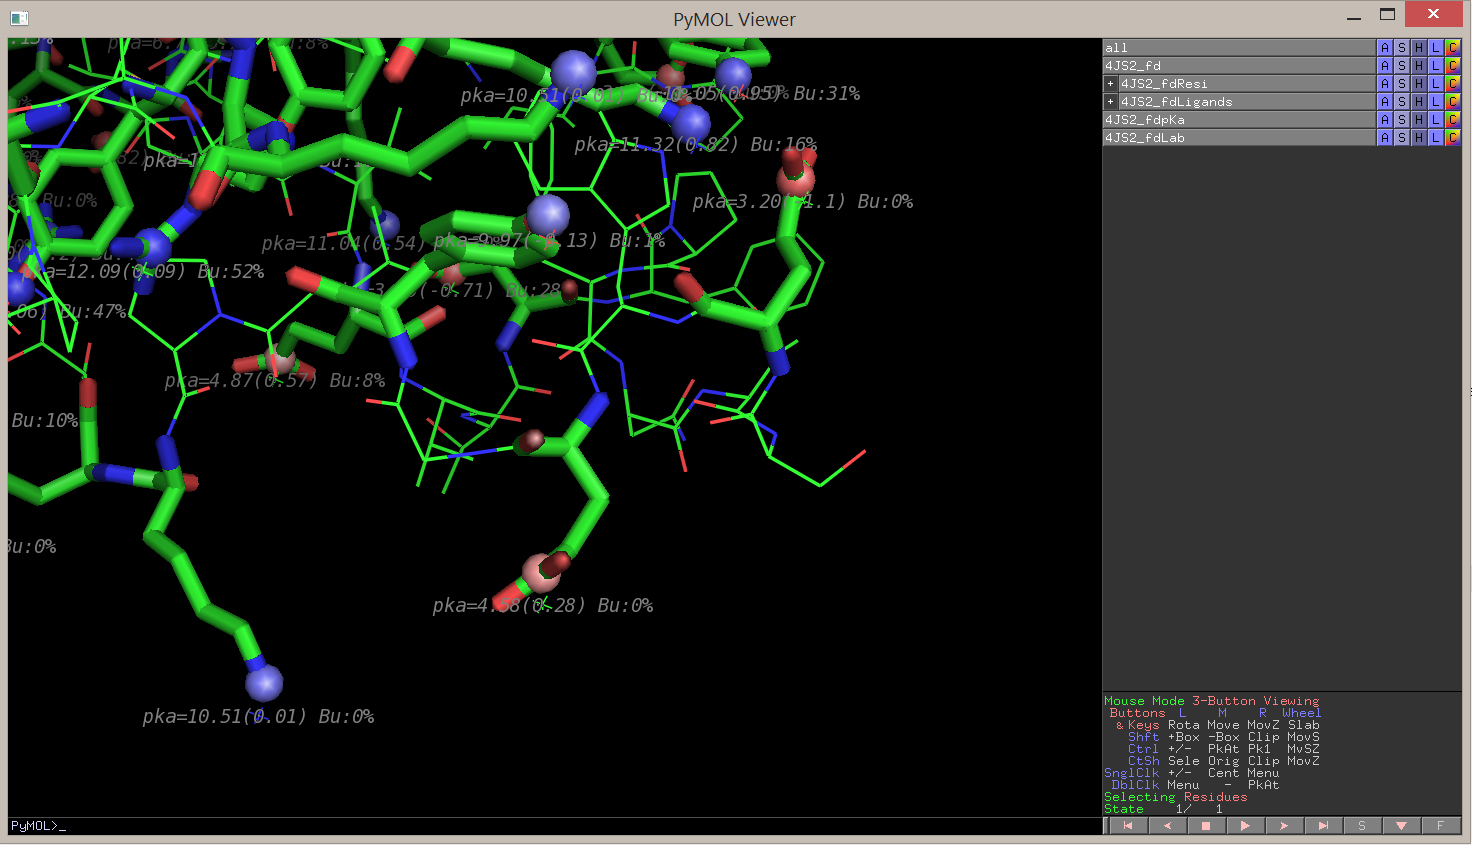
The .pml command file makes pKa atoms, rename them, label them and color them according to the pKa value. Here is how the output looks like:
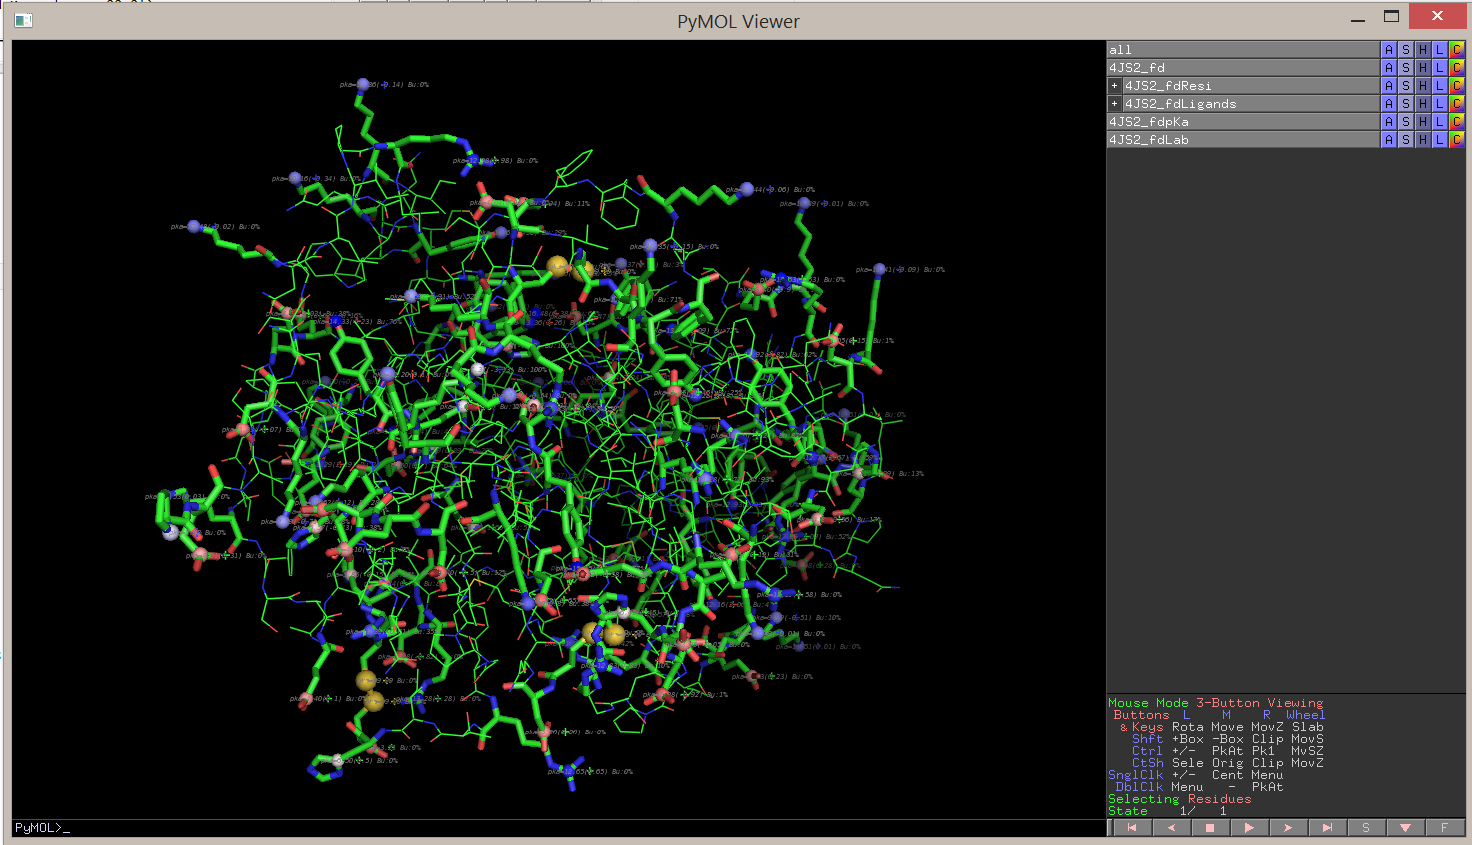
You can then zoom on a residue or a zone that you are particularly interested in:
The PROPKA method is developed by the Jensen Research Group (University of Copenhagen), and you can follow their Github here: http://github.com/jensengroup/propka-3.1 (PROPKA 3.1 for predictions in proteins and protein-ligand complexes).
Cheers!
DH ~(‾▿‾)~
 Tui Lab